Contact us

ElViS Electronic & Vibrational Spectroscopies

Visualize, process, analyze and report various electronic and vibrational spectroscopic techniques

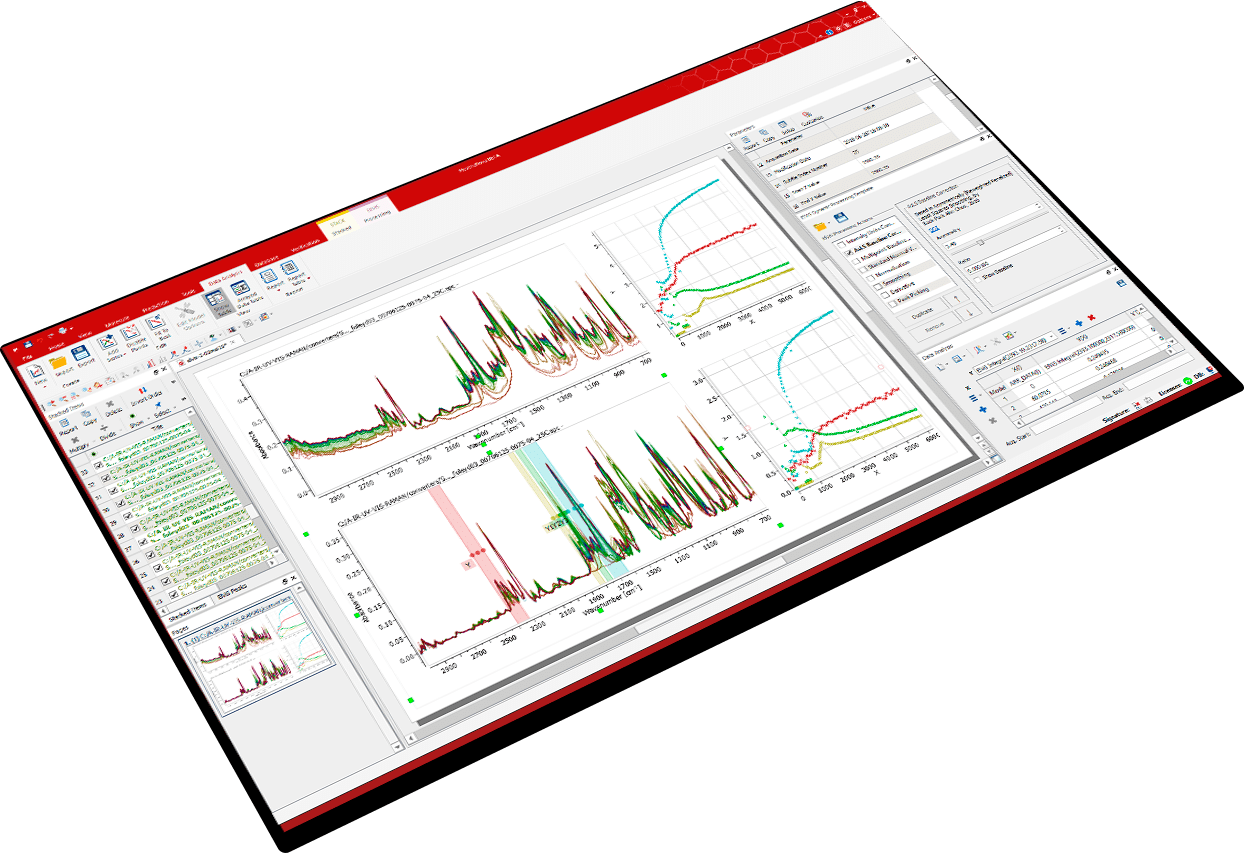
Carry out the analysis of various optical spectroscopy data including ultraviolet and visible (UV/Vis), near and mid infrared (NIR/MIR), Raman, fluorescence, and other spectroscopic methods operating in the whole region of wavelength from 100 nm to 100 µm.


Download Mnova for a 45-Day Free Trial of Mnova ElViS
ElViS Electronic & Vibrational Spectroscopies

Benefits

Spectroscopic processing and analysis of ultraviolet and visible (UV/Vis), near and mid infrared (NIR/MIR), Raman, fluorescence methods.

Vendor and Operating System agnostic, supports most data file formats.

Wide range of processing functions, including a dynamic processing template.

Manual and automatic peak picking analysis.

Data Analysis of stacked/arrayed spectra.

ElViS Electronic & Vibrational Spectroscopies

Features

PLS based baseline correction tool (IarPLS)

Normalization Processing modes

Electronic and Vibrational Spectroscopies supported file formats

Manual & automatic spectral analysis

Main processing features

Latest ElViS Electronic & Vibrational Spectroscopies news

Top features in Mnova 15

Mnova 15 is a game-changing release, introducing new products, versions, and commercial adjustments. Enhancements across plugins like NMR, MSChrom, Chemometrics, and DB deliver an upgraded user experience.

Read more
Help & Resources
ElViS Electronic & Vibrational Spectroscopies

Related Applications

Academic, Government & Industrial

Target Audience

Organic Chemists
Medicinal Chemists
QC Experts
Process Chemists
Analytical Chemists
ElViS Electronic & Vibrational Spectroscopies

Related Products

This site is registered on wpml.org as a development site. Switch to a production site key to remove this banner.