Three features from Mgears that you absolutely need for your high throughput analyses!
High-throughput (HT) analyses have become extremely popular, if not essential, for daily activities in the majority of analytical laboratories, ranging in use from R&D, to manufacturing, to quality control. These analyses produce large volumes of analytical data that require significant time and effort to manually process and interpret. In this short article, we are going to show you three features from Mnova Gears that are particularly valuable when dealing with such huge volumes of data.
1. Automatic matching and grouping of spectral datasets for analysis
In some analyses, additional input information (i.e., molecular formulae, compound IDs, concentrations, etc.) can be required to achieve peak assignments, calculate output values, or even group multiple spectra before simultaneous evaluation. Input information can also be relevant for the evaluation of results post-analysis. Providing such details for each spectrum can quickly create a bottleneck in your workflow when performing HT experiments.
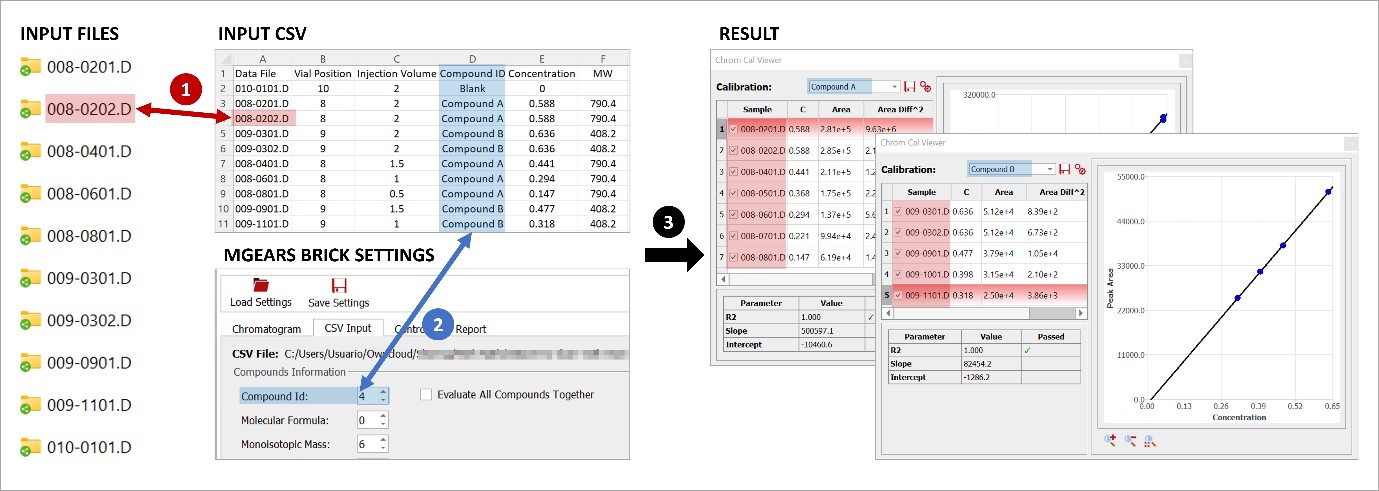
Mgears accepts input csv files (mapping files) and can match the information provided to the corresponding datafile without the need for further manual intervention.
In the example below, (1) Mgears matched the data file with the input information using the “Data File” name, then (2) Chrom Cal grouped the datafiles using the “Compound ID” information, and (3) generated the calibration curve corresponding to each compound.
Mgears also accepts input sdf files and can match each molecule in that file to the corresponding datafile.
2. Flag system for quality control of the results
Reviewing analysis results is crucial to complying with quality standards. However, reviewing hundreds and sometimes thousands of individual spectra is a complete no-no for your productivity, and your sanity!
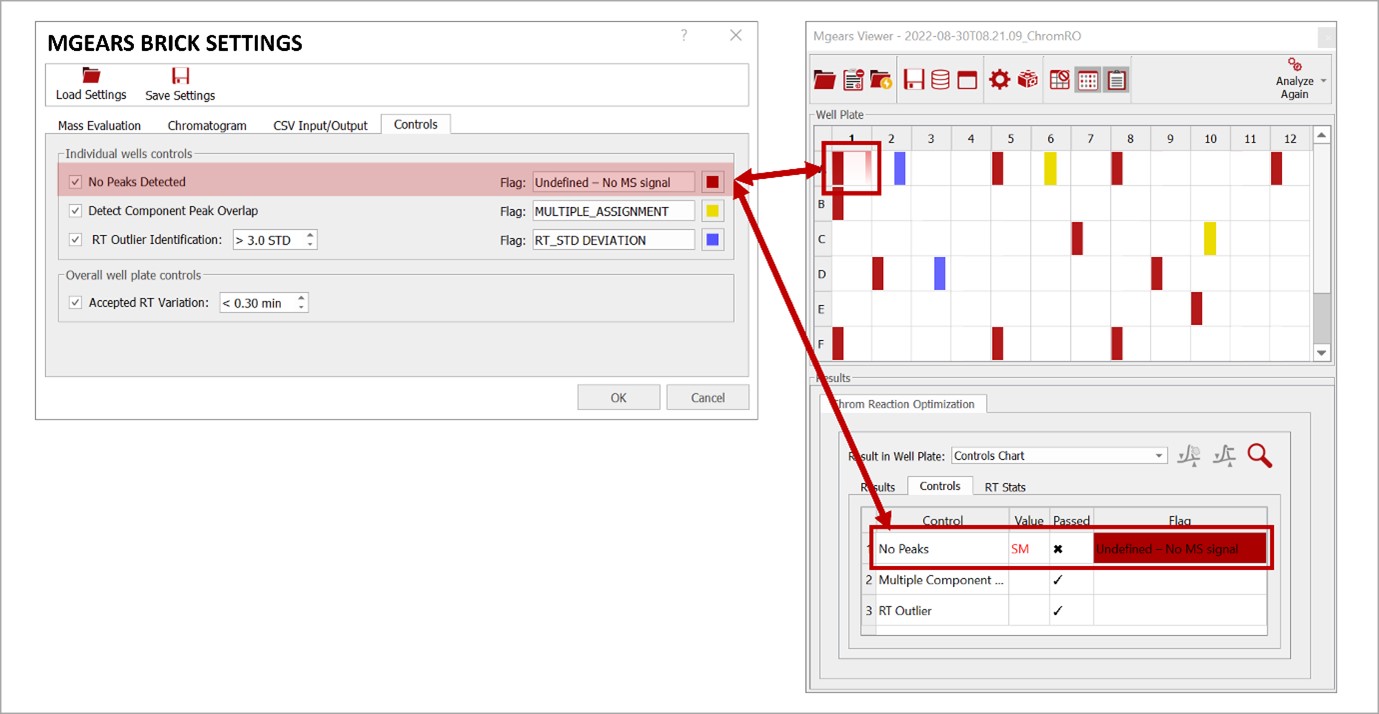
With Mgears, acceptance criteria can be defined for an individual well or for an overall analysis result, and a colored warning flag can be configured to appear when a result does not fulfill the specified requirements, which enables a review-by-exception strategy that saves vast amounts of time.
In the example below, Mgears detected non-conformances and displayed the corresponding flags in the Mgears Viewer. The samples/results that need your attention are therefore easily identifiable, and can be reviewed, corrected, and re-analyzed immediately.
3. Automatic reporting and archiving of results
Reporting and archiving analytical results are two mandatory steps in any analysis. Reports must be nice and clear, and the results must be easily searchable and extractable for further inspection and/or re-analysis.
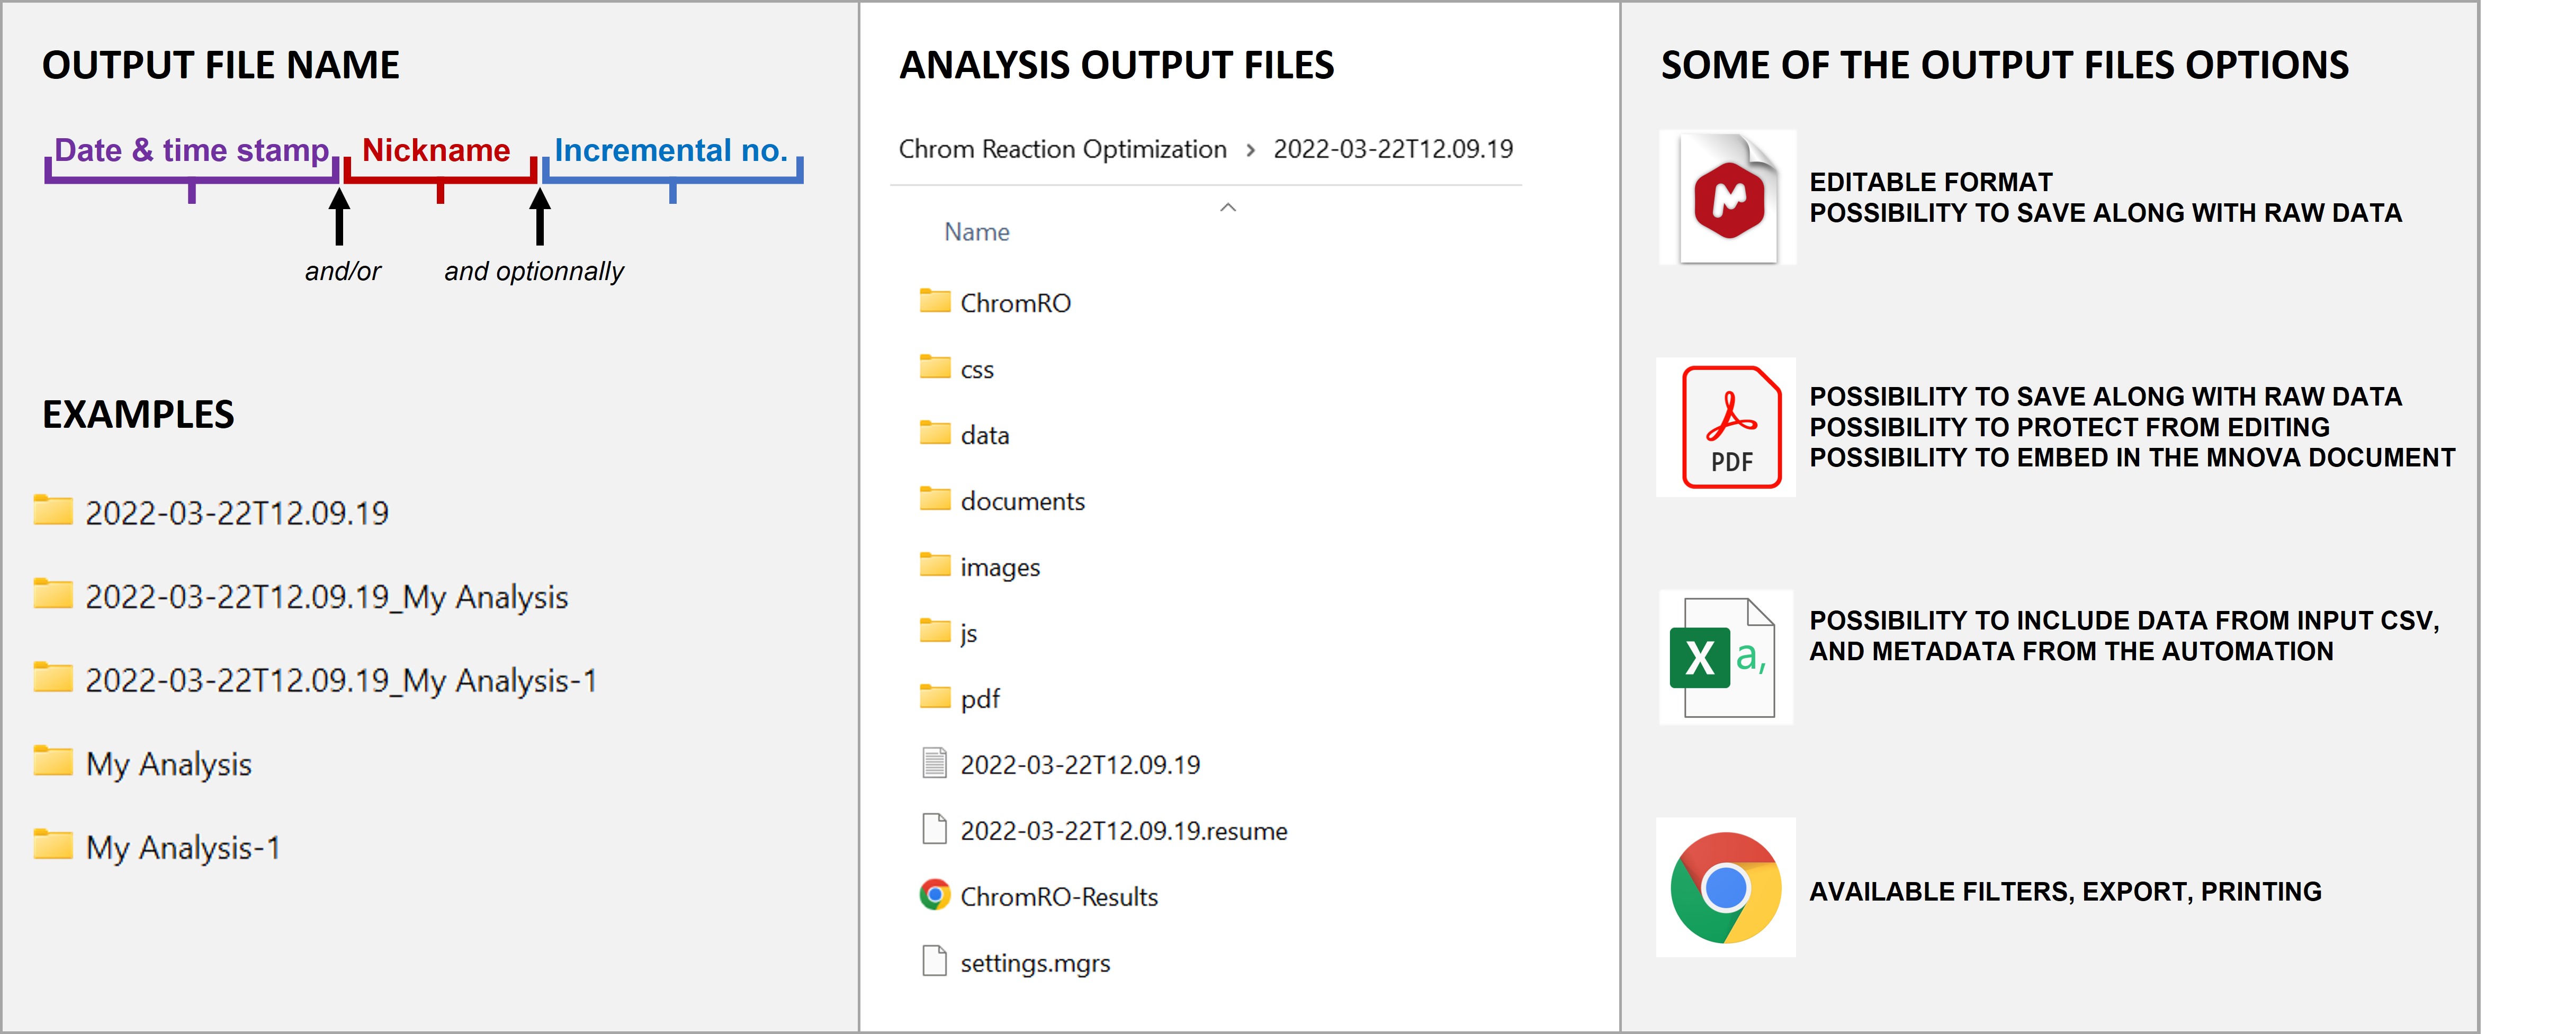
Mgears carries out these tasks quickly and in a fully automated manner. It can produce reports in a range of formats (PDF, Mnova, CSV, HTML, JSON, etc.), and save the analysis outputs to local disk directories or to a database. There are many output options that are hugely customizable to adapt to your standard procedures.
If you are interested in learning more about Mnova Gears and its capabilities, don’t hesitate to contact us. We’ll be happy to assist you!


