Leveraging the power of automated analysis: let your ideas flow
Experts working with chemistry – from small molecules right up to macromolecules and from pure compounds through to complex mixtures – know that the analytical data acquired by the instruments is empty and meaningless without analysis and interpretation. It takes education, and then expertise developed over many years, to piece together all the clues from the analysis and interpret the data to really make it meaningful. However, with the growth in popularity of high throughput analyses as well as so-called Design-Make-Test-Analyze cycles producing huge volumes of data, scientists and experts are becoming overloaded with data processing and management tasks in which they spend most of their time!
Luckily, advances in lab informatics tools and AI algorithms have reached a point where they can hugely and effectively help in automating data workflows to allow experts to focus on getting insights from the data and solving those really tricky problems. But when it comes to changing your lab processes and implementing new software tools, you may wonder what tasks you CAN automate, and what are those you SHOULD automate.
In this article we explain the kind of analysis that can be automated with our automation engine Mnova Gears and give you some examples of workflow automations we have developed for our customers so you can let your ideas flow…
You can and you should automate…
While applications may differ from lab to lab, data workflows almost always involve similar tasks that can be easily delegated to an automation engine to carry out. These are usually:
REPETITIVE tasks: such as data retrieval, opening, processing, reporting, archiving, etc.
SIMPLE tasks: such as applying a formula to obtain a score, applying a layout template to a report, saving results in multiple formats and/or to multiple locations, etc.
PREDICTABLE tasks: such as flagging discrepancies and/or suggesting actions based on pre-defined set of rules, comparing and validating data, etc.
Now, let’s look at some of the workflows that we’ve helped to automate recently…
Example 1: Real-time structure verification and compound registration workflow
This automated workflow has been developed for a research lab at Genentech to verify molecular structures of newly synthetized compounds and register them to their internal database – in real time and with no human intervention. In their workflow, 1D/2D NMR and LCMS raw data from multiple instrument vendors are detected and paired with the expected chemical structure, processed, and analyzed, then compared with the proposed structure. The result of the comparison is delivered as a score that can be easily interpreted by the expert reviewer, and pasted into a report that is automatically generated and saved to the database. The detailed workflow is presented in this webinar.
Example 2: Unattended quality control data analysis
This QC automation solution has been implemented at Novartis, to control the quality of their DNA Encoded Libraries before release to the market. In this case, LCMS data from 96 or 384 well plates with DNA conjugates are collected from 2 LCMS-TOF spectrometers and batch processed by Mgears to calculate the purity and identify impurities. The analysis output is then reviewed with the Mgears result viewer and non-conformances are highlighted and quickly addressed by the expert spectroscopist. More details on this workflow can be found in this recorded webinar.
Example 3: Automated high-throughput data analysis for chemical reaction optimization
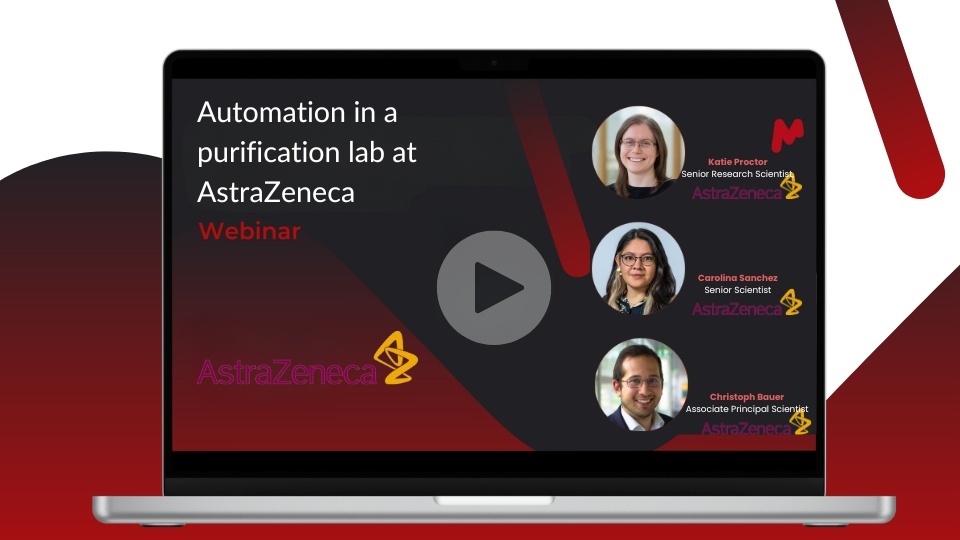
To simplify and speed up chemical reaction optimization at the drug discovery lab at a large pharmaceutical company, we have developed a tool that allows the tracking and quantification of a set of molecules across multiple parallel reactions. The plugin retrieves and matches LCMS data from each reaction with input information provided by the user, then carries out a thorough analysis to calculate the levels of the tracked reagents and products and generate reports. The results are graphically represented in charts that can be easily inspected by expert chemists to decide on the best reaction conditions to employ. Check this () for more info about the automation implemented at Astrazeneca.
Example 4: Batch analysis and determination of the best chromatographic method
Another example is the automation we have implemented at several purification labs to compare chromatographic methods and find out the method that is most likely to yield a pure compound. With this automation, LCMS data from different separation conditions are automatically analyzed then scored following the rules defined by the user. The best methods (achieving the best score) are highlighted in green to make results review easier and faster.
Example 5: Automated hit identification by ASMS
Hit identification by Affinity Screening Mass Spectrometry (ASMS) is undeniably advantageous as it allows the multiplexing of potential ligands and therefore the screening of very large compound libraries. However, analyzing all the data that is produced can be a real bottleneck. So, we have recently created an automation solution to do all the leg-work and present the reviewer with the outcome of the analysis. The automation software detects and groups the raw data files for each sample – the reference LCMS of the ligands to be tested with the LCMS of the mixture of ligands with and without the target protein. Then it analyses the peaks and displays the results graphically with a traffic light system to indicate if hits are present or not in a well.
Some automation results examples…
The final decision is always yours!
Automation doesn’t have to mean a closed loop, with data going in at one end and a pdf report coming out the other end. Let’s face it – human intelligence is absolutely irreplaceable, even with powerful AI algorithms seeming to be able to solve more and more problems, we’ll sometimes need human expert judgment and ability to make informed and often fussy decisions so that we can always ensure high-quality analysis.
That’s why all the results obtained with our automation engine, can be easily reviewed and recalculate either for a single sample or an entire batch. And while we continue perfecting our methods and algorithms to improve automation output, we want to make sure that scientists can still interact with the data, review the results of the analysis, spot the trends, and override the results to make the best decisions!
Let’s end with some good news for you
As you start to think about improving your workflows, we hope that you’ll realize that there are a whole lot of solutions that we already created – and they could be perfect for you. And if the perfect solution doesn’t already exist, we can work with you to understand your analysis, figure out what can and should be automated and create the perfect solution for you.
____
This article is the third of our 4-parts series on lab workflows automation and integration. If this topic is of interest to you, don’t hesitate to check our two previous posts and stay tuned for one more post soon!
The lab of the future is already here … It’s time to ACT
No Automation is an Island – Integrating Mgears into an IT infrastructure


