QC Profiling – Starting guide
QC Profiling is a new brick or plugin of Mnova Gears. It has been designed as an automated evaluation for the quality control of reactions used to generate DNA Encoded Libraries for drug discovery.
General workflow and general configuration
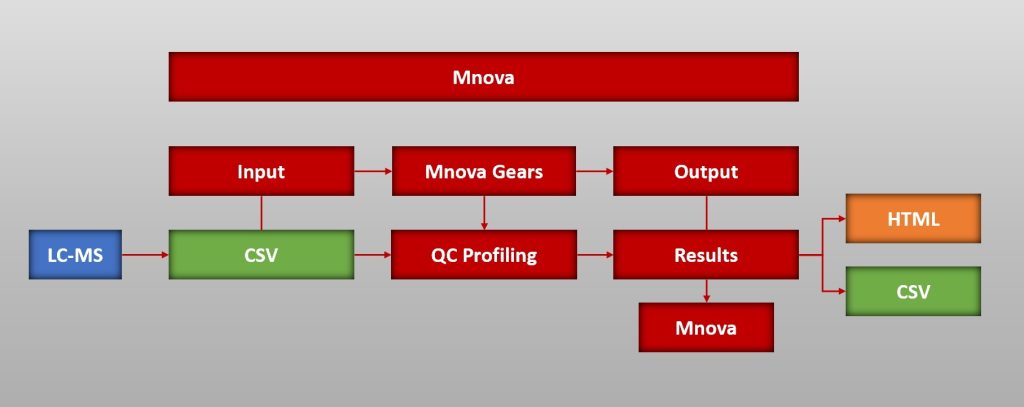
- To run an evaluation with QC Profiling you will need a .csv file and the raw data from your device
- Before configuring the plugin settings you must configure some settings in Mnova Gears too
- Start the evaluation and get the results to analyze in Mnova, Browser or as CSV file
IMPORTANT! You must have a valid license for Mnova Gears (with Mnova ≥14.2)
You can carry out your QC Profiling analysis from the ‘Mgears’ tab in Mnova
CSV files
Take your .csv file and prepare it for QC Profiling evaluation:
- The csv must have an ID Column containing parts of the names or paths of the raw data files.
- The molecular weights or formulas of the components of the reaction must be provided in columns of the csv file.
Configure Mnova Gears Settings
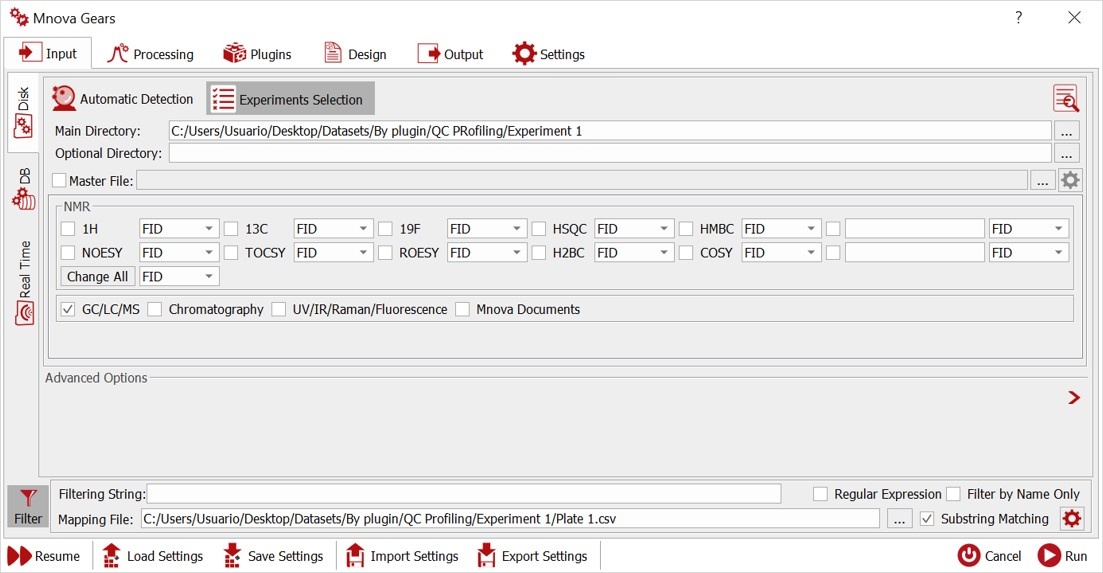
Select your Main Directory and Mapping File. In Advanced Filter, you need to match the ID column number with your .csv file and select the number of rows for the evaluation.

Define your CSV Separator and check in Masks Manager if the mask of your Mass input files is in the list, otherwise add it manually.

Check your data with Automatic inspection of the selected directory to find errors.
Select your automation plugin in Mnova Gears
From all the automation plugins you may have within Mnova Gears, select QC Profiling.
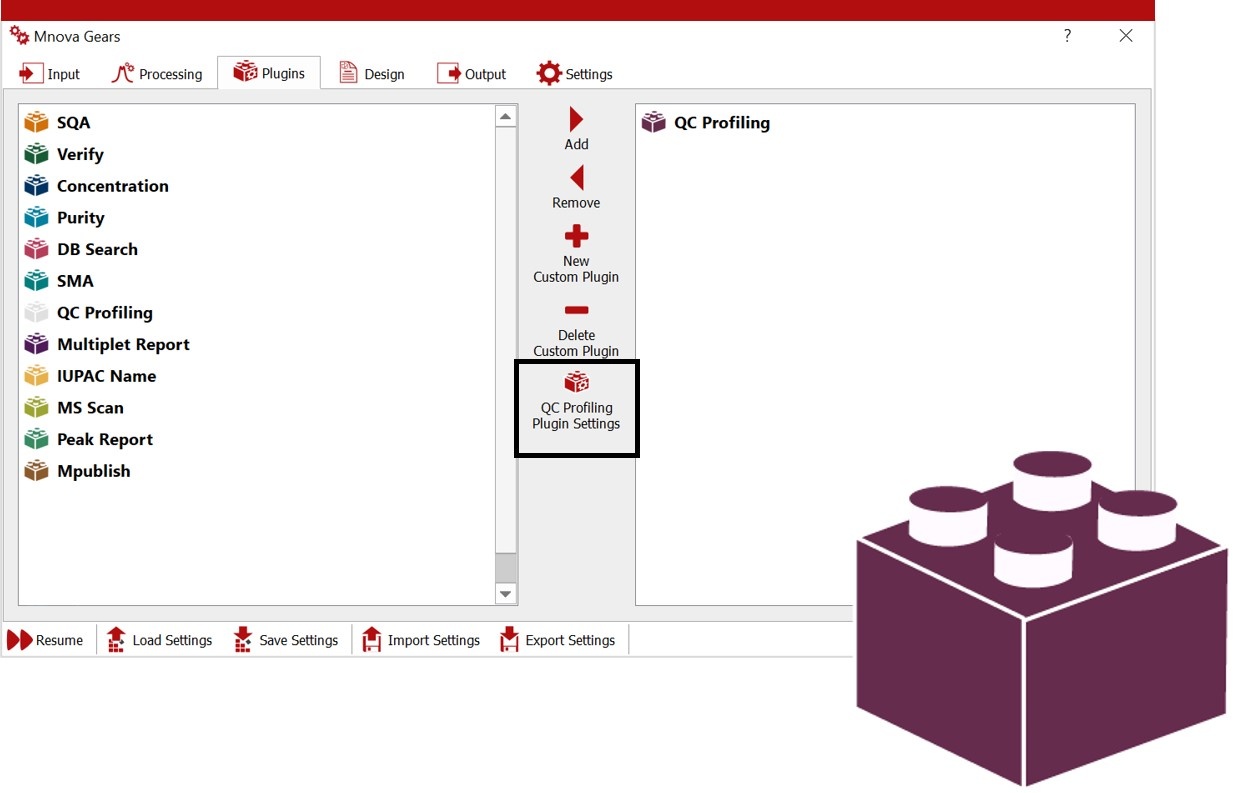
Configure your Output
You just need to select a suitable output directory that matches your needs.
QC Profiling Plugin Settings
Open and configure ‘QC Profiling Plugin Settings’ for your analysis accordingly:
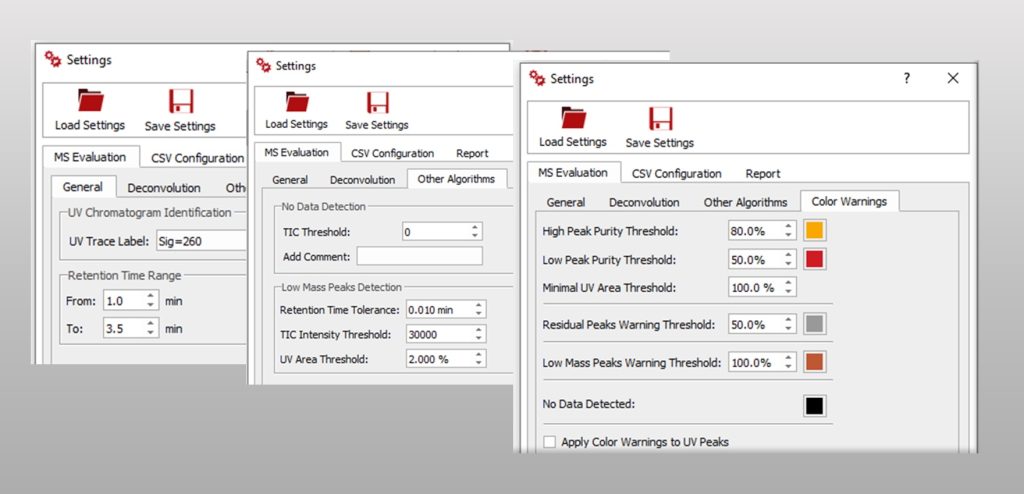
In MS Evaluation you can find all the parameters required to configure your evaluation such as the retention time range and other data required to configure the MS deconvolution methods used by this plugin. You can also configure color warnings to indicate different issues detected in the automation and facilitate the visual inspection of the results.
CSV configuration tools
You can use several configuration tools for your csv such as adding content, insert and empty rows and edit or move any selected row.
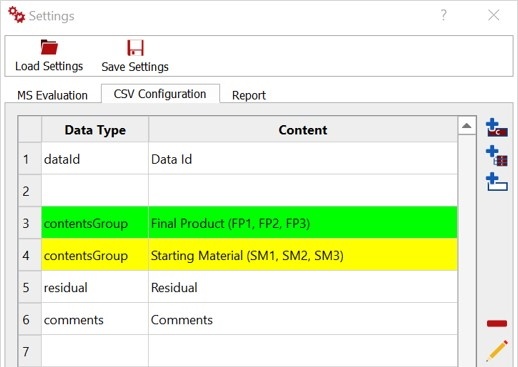
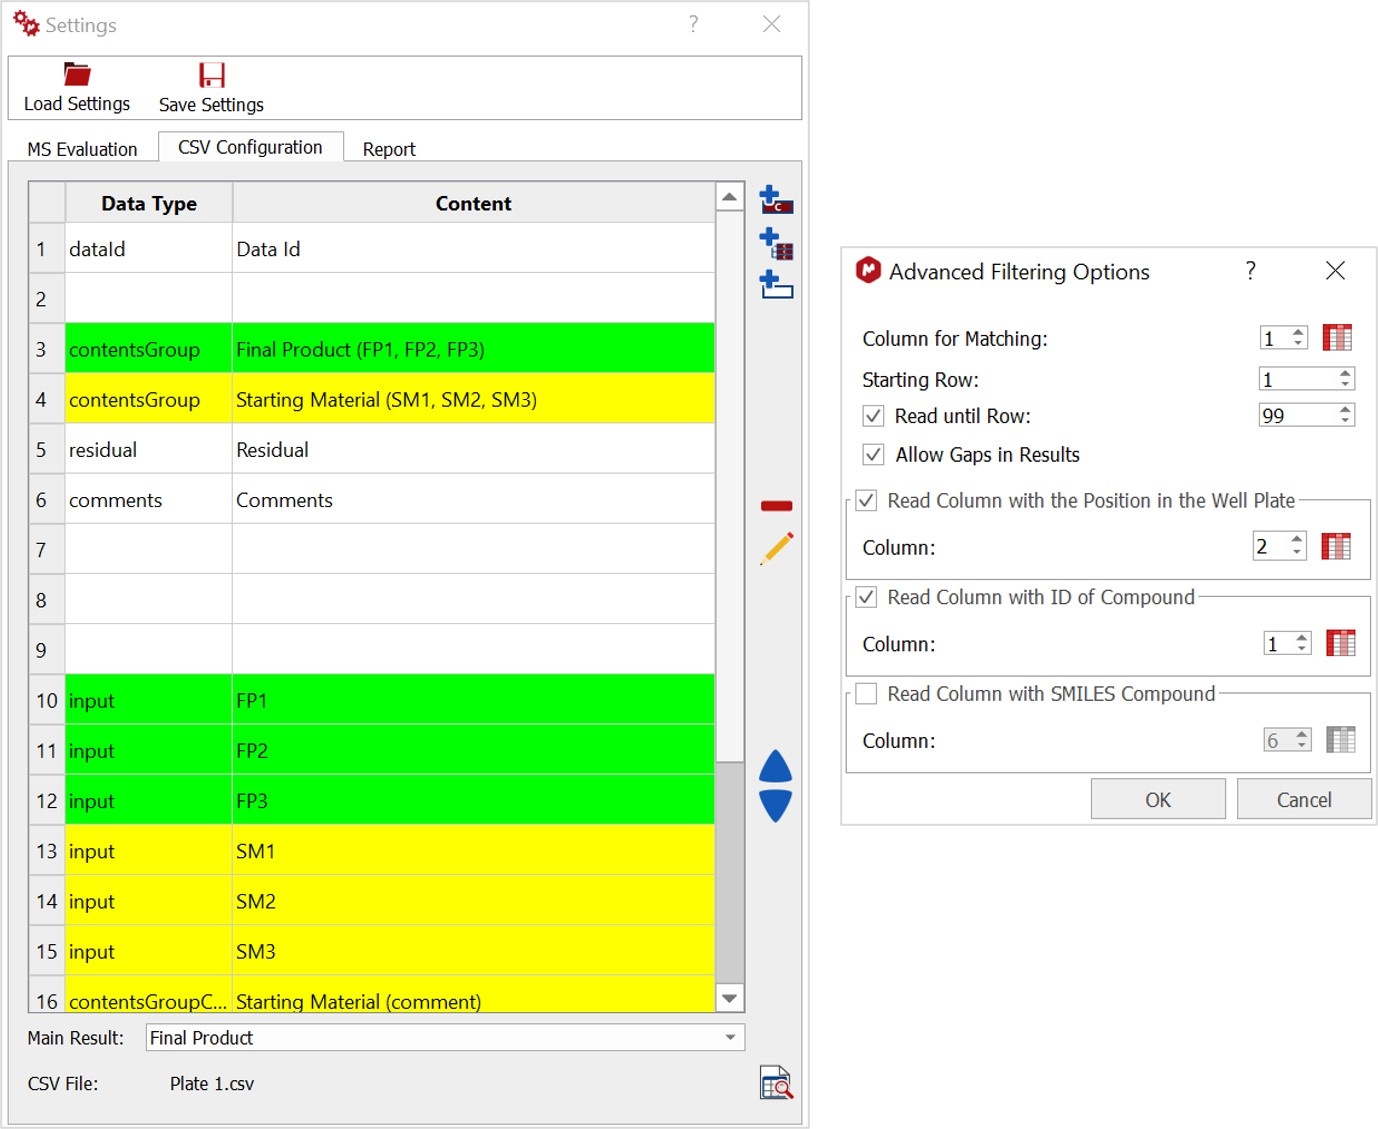
CSV Configuration:
You can create a table for the evaluation, for this, there are three rows that will always be present (dataID, residual and comments). Each row in the table describes the content input or output of a column in the csv file
More rows can be added as individual content or as a group of contents (unlimited). Each row can be moved up and down, edited and removed.
The next step is to add and edit a new content definition and content groups. Each row represents a column header from the CSV file. A content group is the sum of columns wiht the same color.
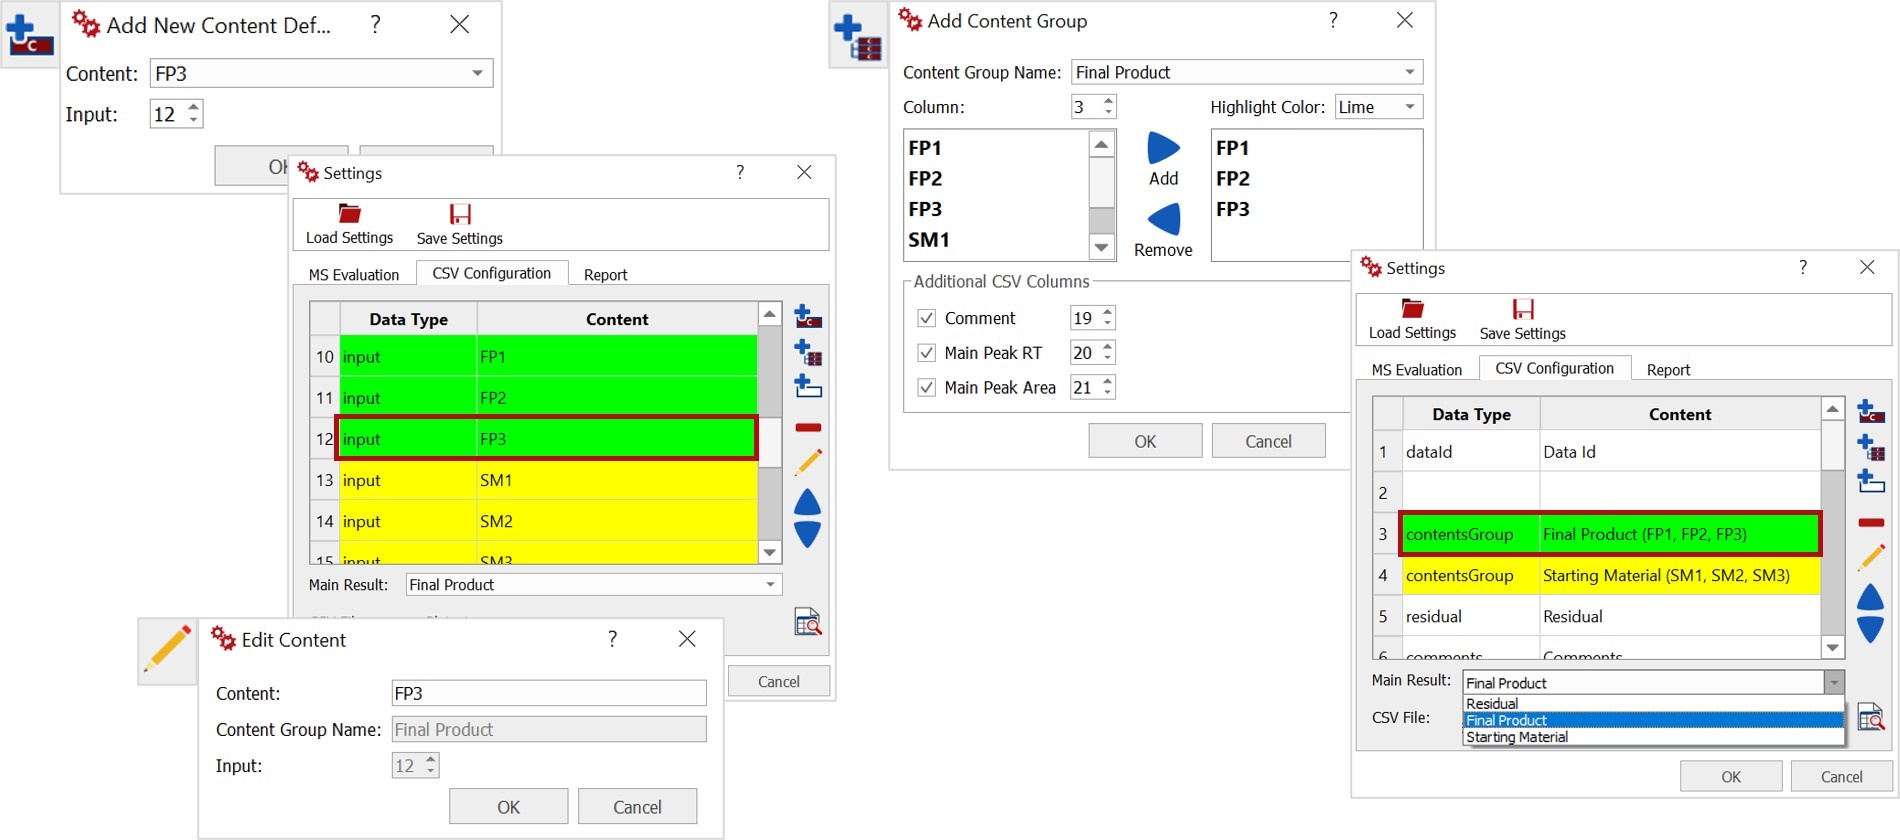
Then you must select what component of the mixture will be considered as the Main Result in the output review options, this can also be changed in Mnova Viewer.
Plugin settings
After creating your table you can check it with the ‘CSV File Columns Overview’ button and see if your table matches your csv file as well as the ‘Advanced filter’ tool.
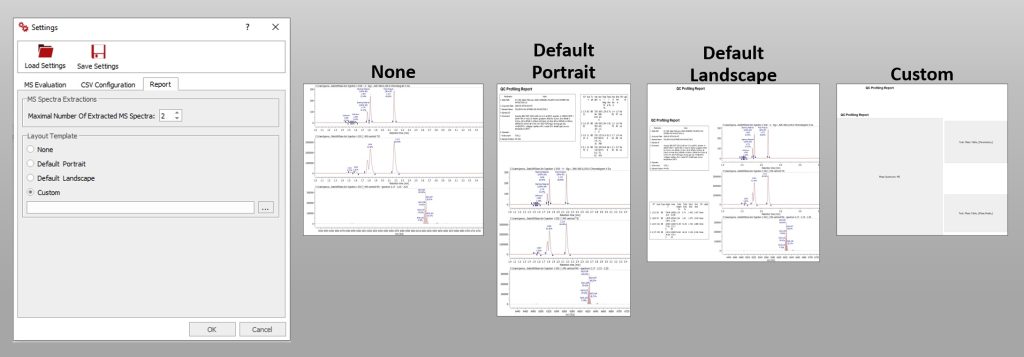
Configure your report
For this you just need to select the number of Extracted MS Spectra for the evaluation document as well as the Layout Template or design you prefer.
You can save the QC Profiling Plugin Settings as .data file or if you prefer to save a more complete file you can save it as .mgrs., including the Mnova Gears settings.
Once the configuration is done, carry out the evaluation to obtain the results in a short period of time.
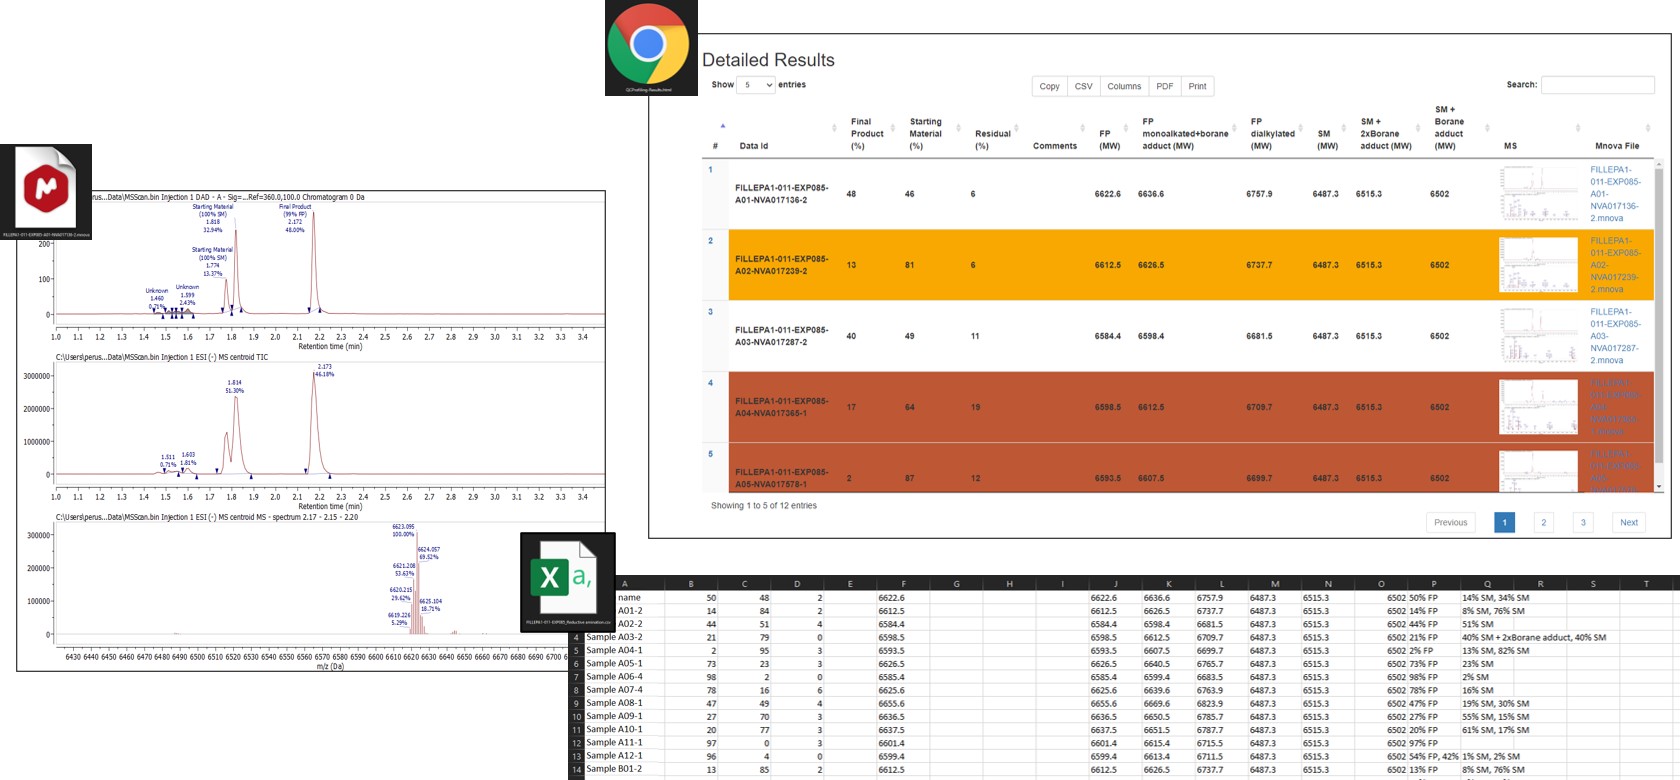
QC Profiling Outputs
You can obtain your results as .csv, .html or .mnova files. Find all the results files in your Output directory, by default the Mnova saves the documents in a folder with the date and time of the evaluation.
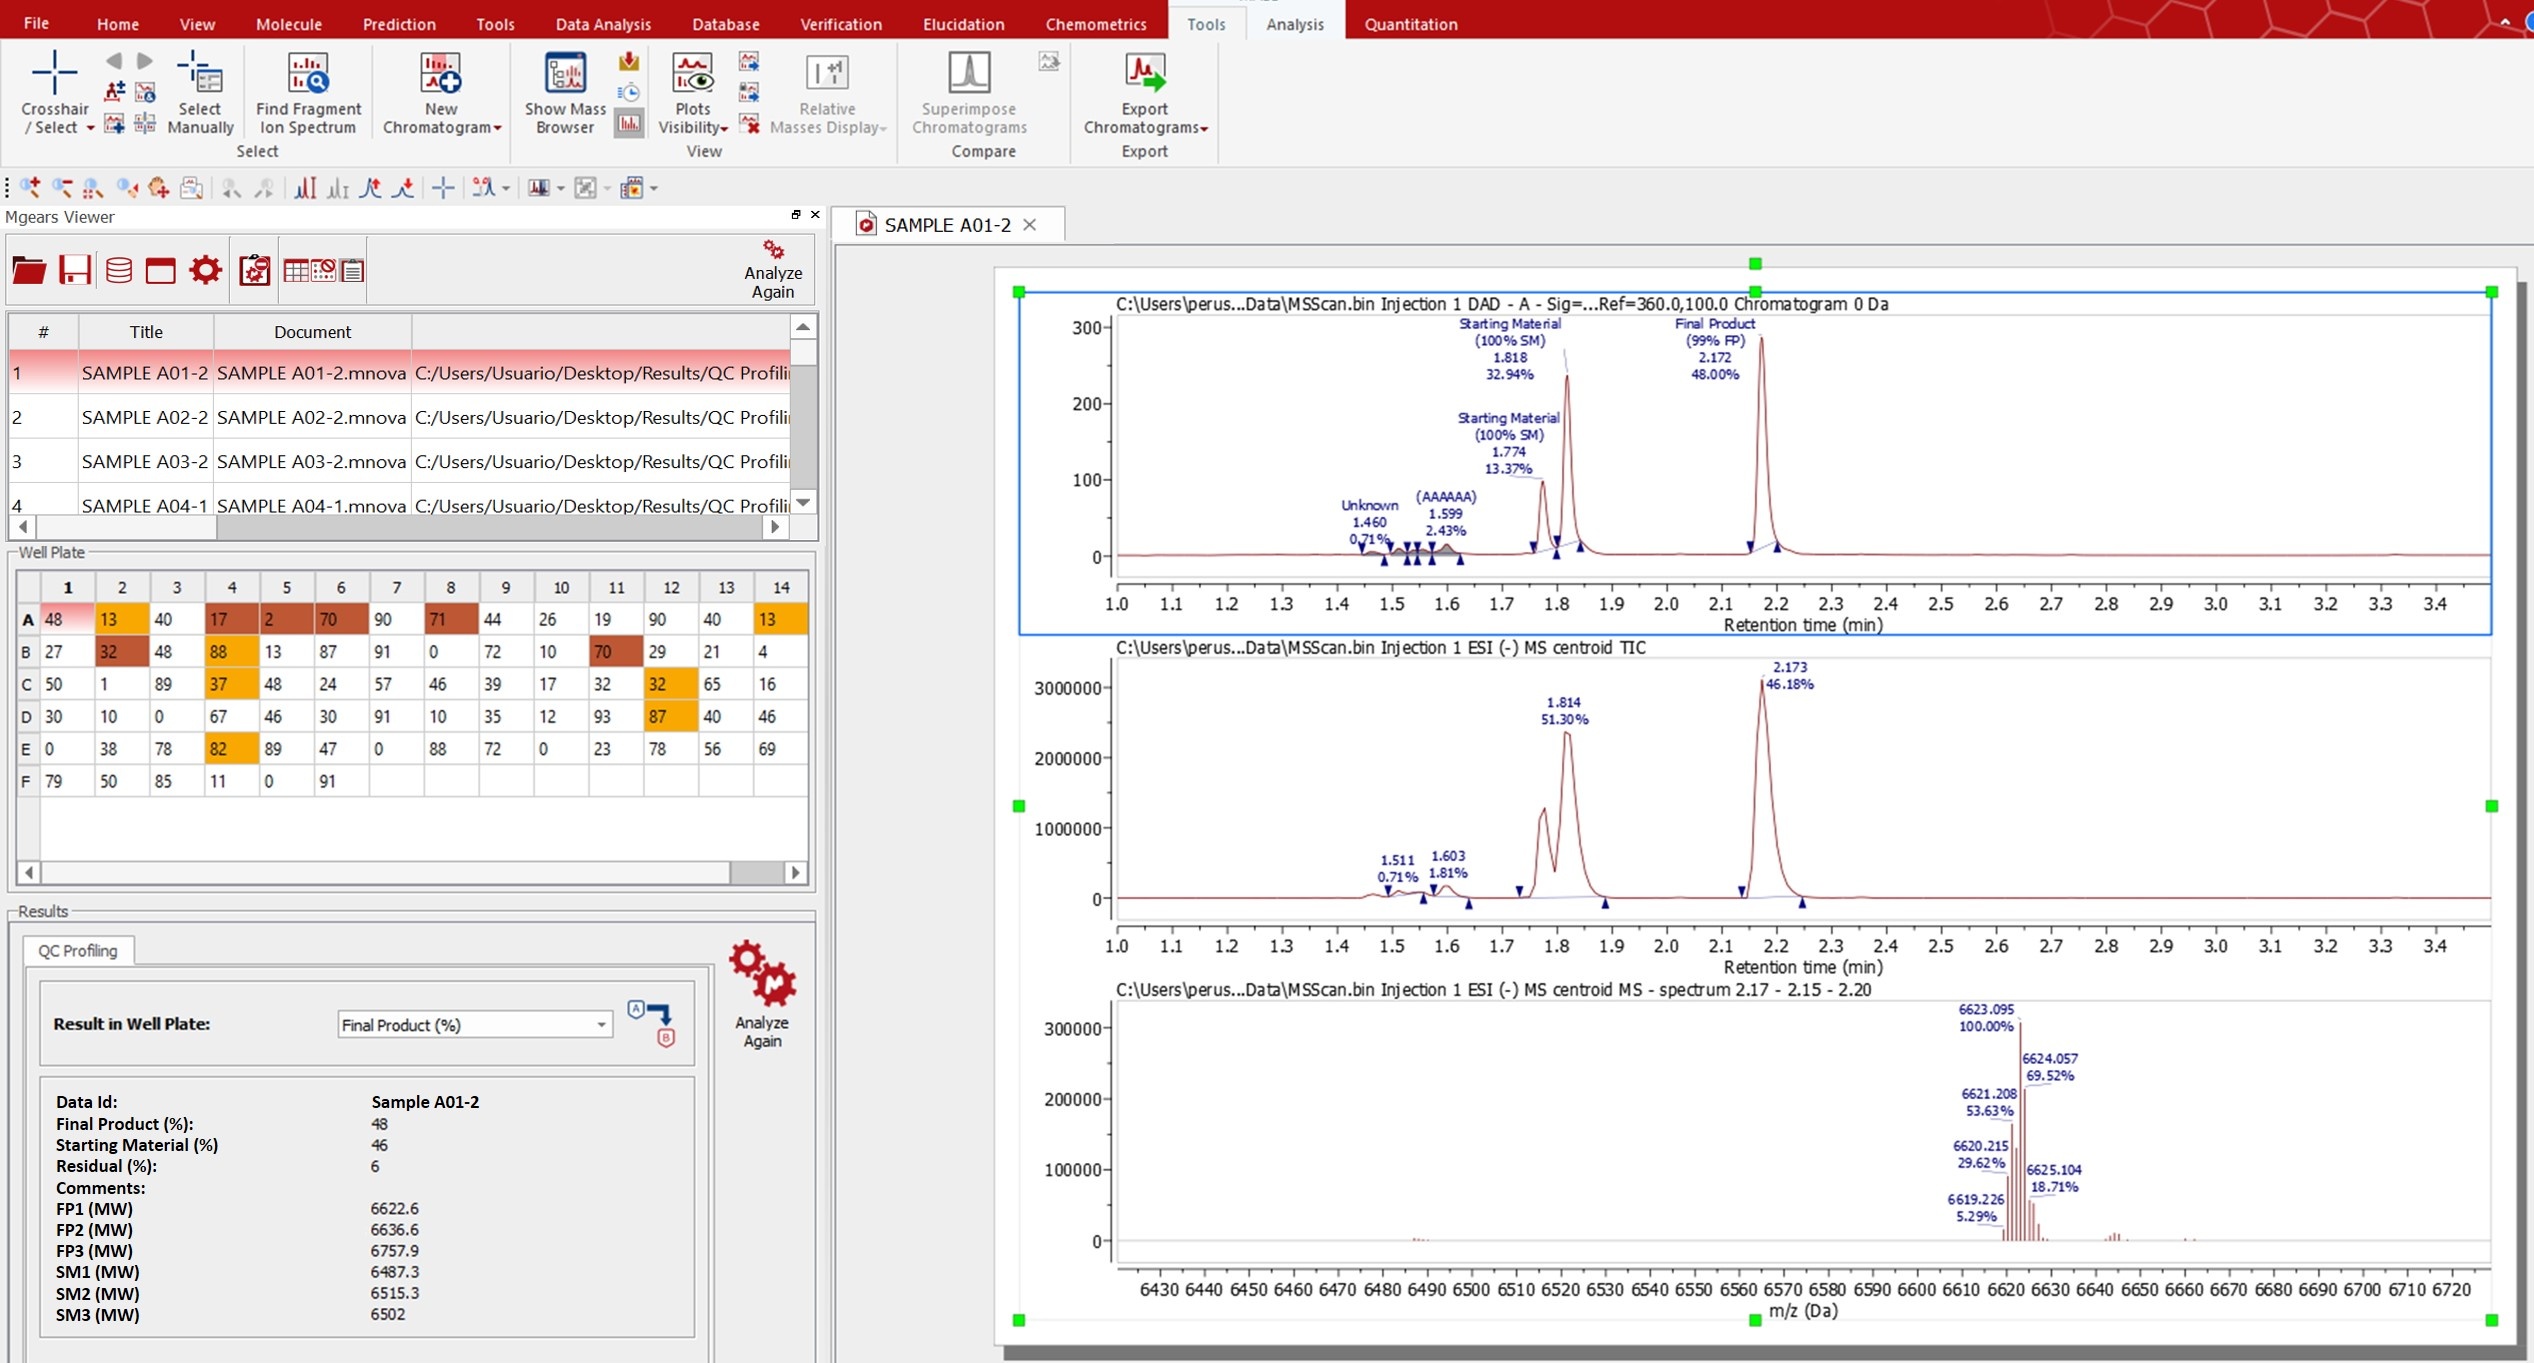
Mnova Gears Results Viewer
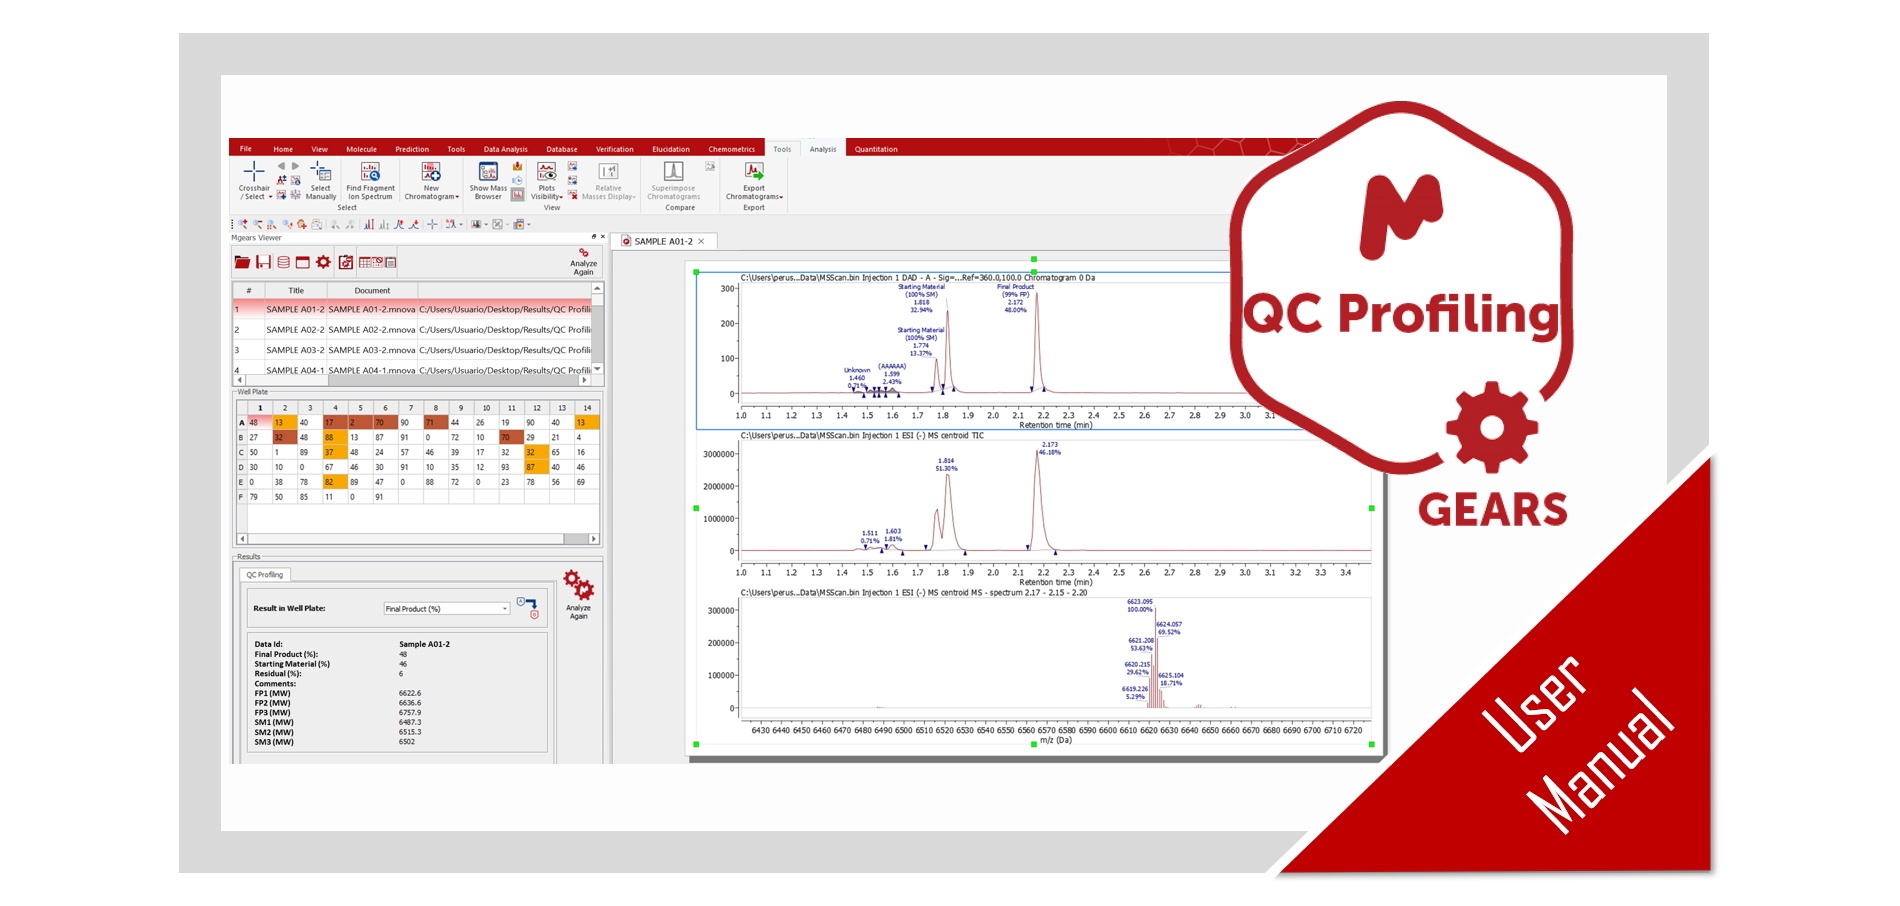
Once you load your results in ‘Mnova Gears Viewer’ to analyze the spectra and the peak assignment, you can carry out several checks using the Color Warning information. Yuo can also edit the Peak assignment and integration using the ‘Manual Assingment’ and ‘analyze again’ tools.
You can go back to our product page to find out more information about QC Profiling
